Discover Your Learning Style

Learning Styles Infographic

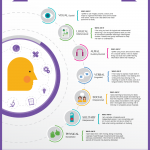
Just like students have different passions, at Ivy College they know that students also have different learning styles. They encourage students to discover what their learning strengths are, and then use them to their advantage. This infographic was created to help learners discover what their favorite styles are. Are you good with images and maps? Then you’re a visual learner. Do you like mathematical reasoning? Then you’re logical. […] Read more »

The 5 Ps of Priority

Priority Infographic

Entrepreneur and author Leon Jay discusses the 5 Ps of Priority in his latest book: Create, Automate, Accelerate. The 5 Ps of Priority infographic offers a clear representation of what it takes to build a business, by asking the necessary questions along the way, in a particular order to help you reach your business goals. Jay realizes the importance of figuring out answers to important […] Read more »

5 Step Guide to Buying a Condo in Boulder Colorado

Condo Buying Infographic

Purchasing real estate can be really intimidating, particularly for first time buyers. But the great news is that it’s not as scary or intimidating as first time buyers might think. While the focus of this guide is on Boulder, Colorado, the material is universal, and we hope other first time buyers will be able to use this simple guide as well. Read more »

How to Choose a Wealth Manager

Wealth Management Infographic

Finding a reliable investment consultant is not an easy task. Some of them are competent, but lack integrity. Others are not knowledgeable enough to provide you with top-tier advisory and management services. You want a person who will act in your best interests. How to separate the wheat from the chaff and pick a perfect wealth manager? First and foremost you are looking for a […] Read more »

Life Insurance Costs Over the Age of 50

Life Insurance for Seniors Infographic

We all know that life insurance is really important, right? Well let’s face it, buying a policy isn’t always cheap. That is particularly true when you reach the age of 50 and beyond. The premiums you will pay to purchase coverage as a senior citizen will be exponentially more than if you were younger. In fact, this could mean your policy premiums will be triple […] Read more »

8 Reasons Why Your Vehicle Will Never Reach its Claimed MPG

Fuel Efficiency Infographic

The New European Driving Cycle (NEDC) is under more scrutiny for having a test cycle that simply does not replicate real life driving conditions. Vehicle manufacturers are claiming mpg figures up to 30% more efficient than they really are. Not only that, the NEDC has so many loopholes, it provides the opportunity for those manufacturers to manipulate the results, such as testing prototype vehicles which […] Read more »

Wake Up to the Importance of Sleep

Sleep Importance Infographic

The conversation around sleep is changing. Whether by choice or due to a sleep disorder, a lack of sleep can and will have devastating consequences. Your health, safety, performance and quality of life severely decline as sleep is sacrificed. Fortunately, good sleep habits can be learned and the effects of sleep disorders can be minimized.   Read more »

5 Best Routes To Drive In The UK

From the EVO Triangle in Wales, to the Snake Pass in the Peak District, there are many driving routes across the UK which are waiting to be discovered. Whether you’re a driver who is seeking a thrill or a driver who likes taking in the beautiful sites on a road trip, this infographic shares some of the best routes around the UK. Original source of infographic: www.wewantanycar.com. Read more »

All About South Africa

South Africa Infographic

Planning a trip to South Africa? Whether for business or holiday, this infographic shows valuable information that can come in handy. Visit one of the country’s numerous National Parks or take in a safari. With this info you can plan well for your trip go prepared about the home of the Rainbow Nation and the Big Five. The infographic can also be useful for students […] Read more »

Tooth Decay and Fizzy Drinks: A Rotten Epidemic

Child Tooth Decay Infographic

Though almost one third of 5 year olds have tooth decay, many are waiting almost a year or more to have their rotted teeth removed. The culprit of the decaying teeth? Dentists across the country are blaming fizzy drinks and sodas as one of the main sources of the epidemic. This infographic delves into the issue of tooth decay in children, pointing out the worst areas in […] Read more »